I am very excited after Microsoft released Power BI GA (general availability) at the end of July. It comes with list of impressive new features which is explained in detail in this MSDN article.
I want my blog readers to know what is Power BI and how it can be used with SharePoint Online to leverage the BI capabilities of SharePoint. Let's learn the basics in this article.
Articles in SharePoint Business Intelligence (BI) Series:
Where can I download the Power BI and related products?
Hope this helps you! Please share you comments since it helps me write more. Also, share this post to your friends via the networks below.
I want my blog readers to know what is Power BI and how it can be used with SharePoint Online to leverage the BI capabilities of SharePoint. Let's learn the basics in this article.
Articles in SharePoint Business Intelligence (BI) Series:
Power BI in SharePoint OnlineMicrosoft came with a new tool for BI for the following reasons:
Creating reports using OData Feed in Power BI
Power View report in SharePoint
Display Power BI reports in SharePoint Online
- Use the known tool - Excel
- Discover More - Power Query
- Analyze More – Power Pivot
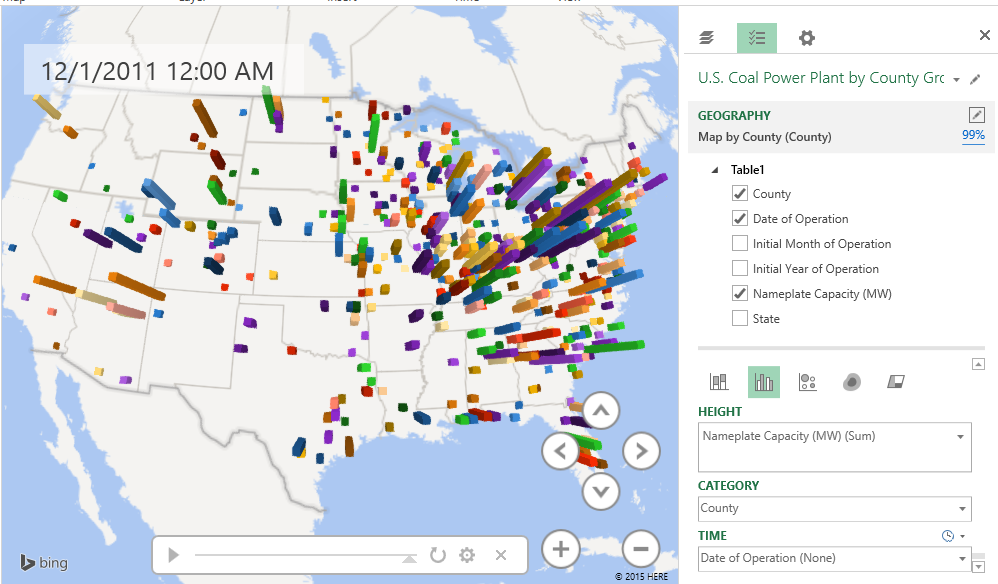
- Visualize - Power View / Power Map
- Combine with Office 365 – share with any one
- Power BI sites – collaborate and share the data sets with your team
- Dive into Q & A – ask a question and get answers visually
- Stay Connected – Mobile Apps
- Schedule data refresh and create security settings easily

- Cloud based service works with excel to provide users a complete self-service BI solution
- Available in SharePoint & Excel 2013 Online (available only in E3 / E4 subscription)
- With Power BI, you can easily deploy a cloud based BI environment for users to share insights, collaborate and access reports from anywhere on any device
- With Power BI for Office 365, you can easily setup an online gallery for users to share insights
- Mobile apps available in Apple store, Windows store & Google play store
Feature
|
Power
BI
|
SharePoint
BI
|
Content Viewing
|
It displays all document
libraries with a preview to reports / dashboards
|
It displays only pivot
gallery document library
|
Natural Language
|
Q & A provides the end
user to search for data with your questions and it displays the results in
visualization
|
No such option available
|
Workbook as a data source
|
Power BI the data model and
the reports (created with Excel pivot tables + charts, or Power View for
Excel) everything must be contained within a single .xlsx file
|
In SharePoint, we can
upload a Power Pivot model to the Power Pivot Gallery and other reports can
connect to it using a URL-based connection string. This works for Power View
for SharePoint, Reporting Services, PerformancePoint, and Excel
|
Data Refresh Option
|
It is simpler for end users
to manage the data refresh
|
Lot of options available
for data refresh and it’s controlled by Admin
|
Data Management Gateway
|
It is a hybrid environment
(partially cloud based and partially on premises)
|
No data management gateway
available
|
Data rendering option
|
HTML 5 (hence cross
platform support)
|
Silverlight for data
preview
|
Maximum workbook size
|
Max is 250MB
|
2 GB
|
Security
|
Sign in with Organization
ID (O365 ID)
|
AD security mechanism
|
Enterprise Search for data
|
Search query is the
important feature and it can search public and data within organization
|
N/A
|
Mobile Application
|
Available in Microsoft,
Apple and Google Play store
|
N/A
|
Where can I download the Power BI and related products?
- Sign up for Power BI
- Power BI for desktop
- Power BI Analysis Services Connector
- Power BI Business Gateway
- Power BI Apps for mobile (apps for Apple, Microsoft and Android mobile)
- Power BI pricing
Hope this helps you! Please share you comments since it helps me write more. Also, share this post to your friends via the networks below.