Showing posts with label Tutorials. Show all posts

Aug 2, 2017

Communication Sites in SharePoint Online

In this year SharePoint Virtual Summit, Microsoft announced several improvements to SharePoint Online and One Drive. One of the important and interesting additions is new “Communication Sites”
Microsoft says: “Reach your audience via SharePoint Communications Site” 😎
In this article, we will learn about what is new about it? How to create it and how does it work? Did we get something newly added to SharePoint Online? Are we really looking at something innovative?
What is a Communication Site?
Communication site is like Team Site in SharePoint site that anyone can create in the organization from SharePoint Home (it is available only in Office 365 and not in on premise environment). So, this is for internal users of organization.
Communication sites are beautiful, dynamic sites that let you reach a broad internal audience, and that appear great on the web, in the SharePoint mobile app, on PC and of course on Mac.
How to Create Communication Site?
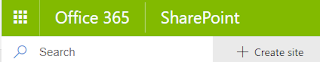
From home page of SharePoint site collection -> click on the app launcher -> click SharePoint -> just click Create Site (if you don’t see this option then your self-service site creation is not enabled for your ID) as shown below:

-> 


If you didn’t get this option, you may have to change the settings in Admin Center -> Settings -> Organization Profile as shown below 😉
For more information of standard and first release options in Office 365, check out this information from Microsoft 🔗
Note: It took just 10 minutes for me to get the updates to my ID after enabling this option. Way to go Microsoft!! 💪Sometimes it may take few hours or overnight to update/assign new features to your ID
I have also noted how fast it creates these sites. It just took 15 seconds in our tenant which is pretty fast!
Communication Site Designs:
There are three types of design available in Communication Site:
1. Topic
2. Showcase 
3. Blank
First two types are pre-configured with some web parts by default and the blank one is to start from the scratch. 
Topic design explained
Use the Topic design option when you have a lot of information to share, such as news, events and further updates with good images which describe the information.
I have created a site collection using "Topic" design which is shown below:
Following are the list of web parts(some NEW) or the changes made to this site collection or you will observe in this page:
I have explained each web part/changes in detail below:
NEW Hero web part
This is a new web part which has tiles with various layouts available to show the highlights of the site. You can embed a image, link to the external content. I would say there is no need to create a custom news slider/carousel 😉 Just configure this web part!!
News web part 
This is existing web part where you can add images, link to the SharePoint pages with content and in side by side layout. I have added few images, content from Microsoft which is shown below:
NEW Events web part
This web part shows the upcoming events. It's not new, but it just the good old Calendar list but displays in a different view in the home page as shown below:
Quick links
This web part aggregates quick links to documents, pages or to external URLs. This web part is actually empty which is not visible upon site creation but will show up once customized as shown below:
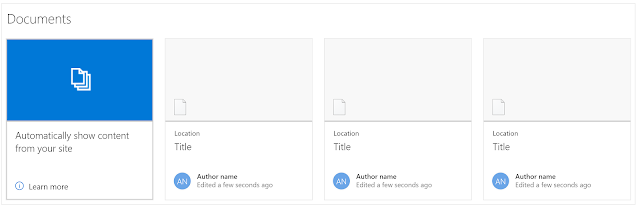
Documents web part
An existing web part pre-configured to show 10 items of the current site’s document library, in a card-style layout.
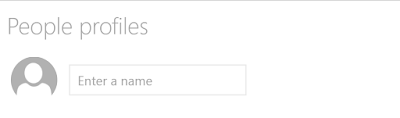
NEW People web part 
This web part is empty when the page is added. You can add the people to contact or someone who is related to that page or team members, etc. This is linked to Delve profile.
Comments on Page
Each news article and page can have its own set of comments. So, commenting on page is possible now.
Disabling comments to the page option is also available. Comments can be switched OFF/ON with the below option shown below:
Easy Page Layouts (finally!!)
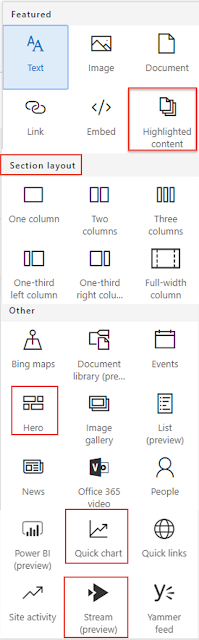
Now with communication sites, you can use a variety of multi-column section layouts on your pages, to arrange information side-by-side. Click on edit page to view the page authoring toolbox. It has new Section layout choices. 
I personally think this is one of the best features newly added. This will help to have multiple layouts on the same page and it is easy to create as well - Just in clicks. This will help the content editors/authors to create pages in SharePoint easily than before.
Top Navigation changes
New way to edit the site links, name and title from the page without navigating to other pages as shown below:


NEW “See all” pages
When there is more content than can be shown within the first view the Highlighted content and Site activity web parts, you can click See all to go to a full-page experience to see all the content and activity.
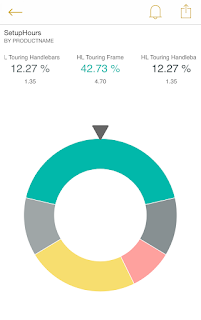
NEW Quick Chart
As the name suggests, this web part allows to add a chart quickly and represent your data in either bar or pie chart. Up to 12 data can be added which is allowable limit now. I am sure MS will add other chart types soon.
Also, this is not a web part where you connect the data, show real time results but this is a web part which allows the content authors or power users to visualize the data quickly.
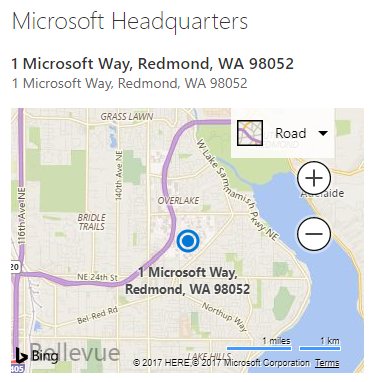

NEW Bing Maps
With the Bing Maps web part, you can display a place / address and pin the location as shown below. This has Road, Street and Aerial views like normal Bing Maps.
NEW GIF support
When you add an Image web part into a news article or page, you can now include animated GIFs in your layout.
Power BI Integration
Bring in interactive reports using the Power BI web part, display reports and dashboards in a single click. 
Microsoft Stream
With the Stream web part, you can display a video from Microsoft Stream directly on your site. Screenshot at the end of Topic Design explanation 
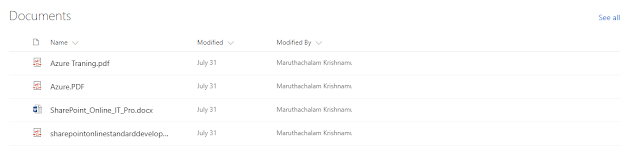
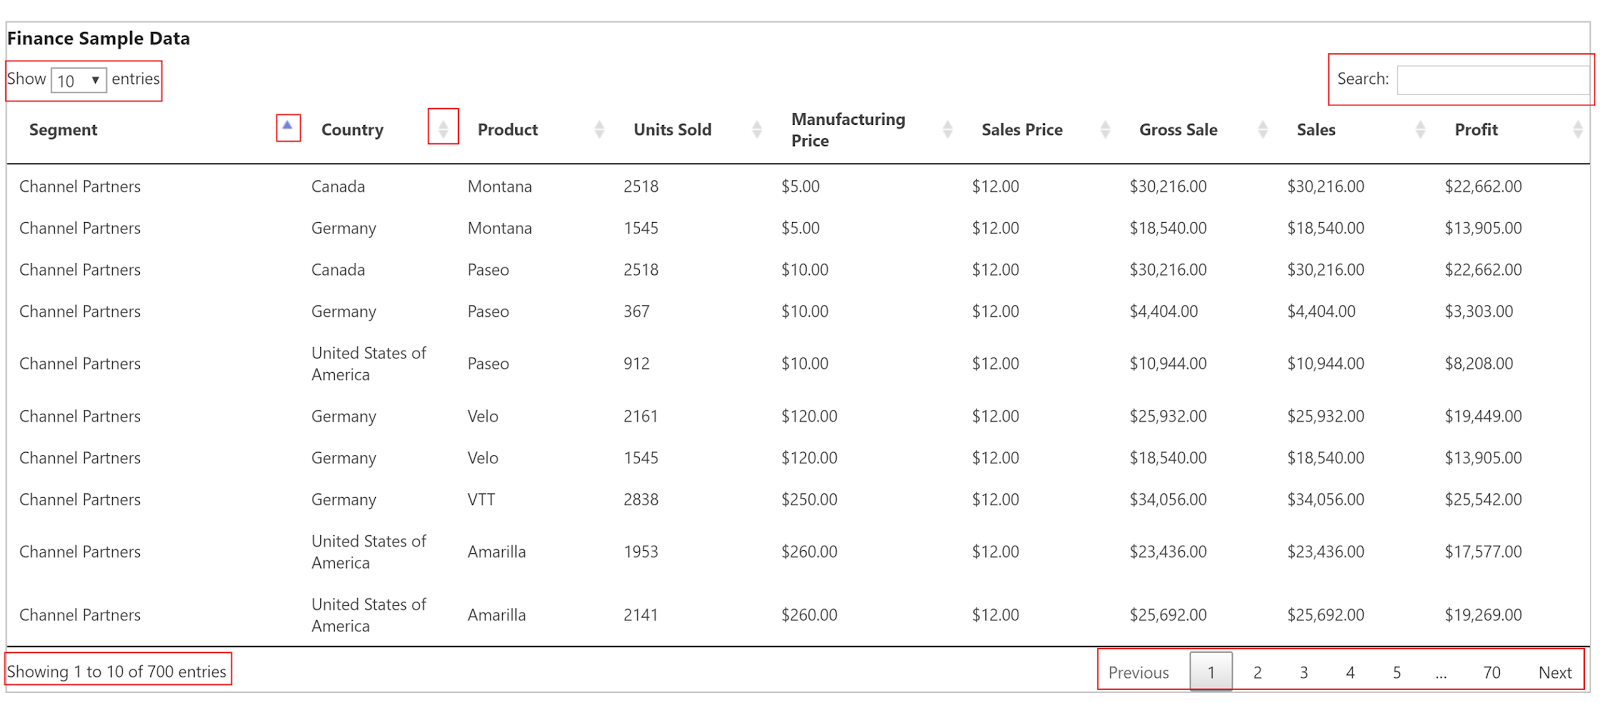
NEW Document Library/ List Preview
 As the name suggests, both will display the preview of Document Library and List respectively. It is like List view web part but we have quick options to limit the items displayed. It has Auto Size, Small (5 items), Medium (15 items) and Large (30 items) display options. It also has "see all" option to view all items.


Yammer integration
It is now possible to use the Yammer web part for broad discussion scenarios as well as targeted responses to engage your viewers on the message and content on the page.
Share news via email
When you share news via email from a communication site, it’s not just a blue link but a visual, informative preview that adds context to both the email and the news article itself.
Within the email, the recipients will see a thumbnail, title, description and an optional message from the sender.

Set Focal Point
In the modern UI, a site page has a top image which was blank previously. Now, Microsoft has added a really nice touch to this page header; a way to add a image and also re position the focus on the image. In edit mode, you'll find a "Set focal point" button on the top right.
Consume, create and connect from your mobile device via the SharePoint apps
It’s easy to access, engage with and create content for communication sites from any device. The full site, pages, news, navigation, search and more are native view able, functional and engaging. Almost you can do everything using mobile app 😉
You can download the SharePoint mobiles apps for iOS and Android. Learn more about the SharePoint mobile app for iOS, SharePoint mobile app for Android and SharePoint app for Windows 10 Mobile. 🔗
I have also tried to create a page and add some of this web parts / features which looks as shown below(Some images, Videos embedded belongs to Microsoft):

Modern Page Editing
New page layouts available when you create a page:
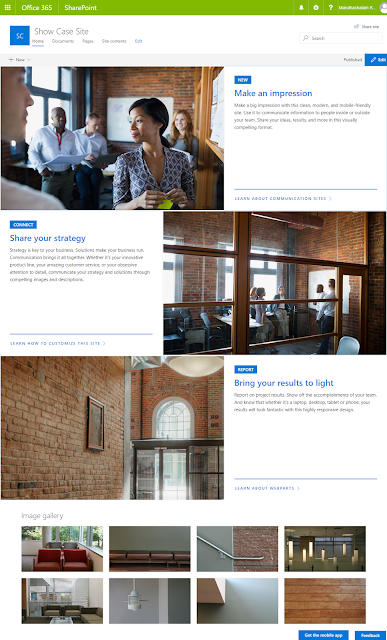
Showcase Design 
Use the Showcase design option to feature a product, team or event using photos or images. This site is more simplistic. The home page contains only the new Hero web part and a classic Image gallery web part in the home page.
Its purpose is to hold information that is more "static". Like the description suggests, it's a perfect layout to present a product, a team or an event.
 
Blank Design Explained
Use a blank site and to piece together your own vision for a communication site to share information of your choosing. 
Tons of cool features!!! We will explore more in the forthcoming articles as well.
See Also


Please free to comment. Always. your comments help me to write more.😃 Share this post to others if this helps you!😇
Don't forget to subscribe to the posts to get notified about new tutorials by clicking the Subscribe button on the top right corner and follow us in social buttons as well.

Jul 25, 2017

Power View report in SharePoint

Introduction:
Welcome to Business Intelligence Article series, readers 😉 Yes, we are going to learn in detail about Business Intelligence (BI), Creating Reports, Data Refresh, Integrating the BI reports with SharePoint, etc. in the forthcoming articles.
For every business function automation or where you have large data stored - BI reports play a vital role in analyzing the existing data, improving from the past experience and predicting the future of business, etc.
In this article, we will learn how to create Power View reports from SharePoint list and integrate with SharePoint in detail.
So, make sure you subscribe (look at the options at right top corner) to get the latest articles in your email or notified about the latest articles!
Articles in SharePoint Business Intelligence (BI) series: 🔗

Power BI in SharePoint Online
Creating reports using OData Feed in Power BI
Power View report in SharePoint
Create Power BI report and publish in SharePoint
Environment:
SharePoint Online - Office 365 (should work in SharePoint 2016 & 2013 versions as well)
Excel 2016 - Microsoft Office 365 ProPlus (should work for Excel 2013 versions as well)
Why Power View?
If you have already migrated or migrating to SharePoint Online and want to create reports/dashboards in SharePoint then following are the options available:
1. Using Excel Services/Excel Web Part
2. Power BI
3. Using third party solutions
4. Custom solutions using JQuery chart plugins
💡If you look at the above options, using Excel Services and Power BI are the easiest ways one can create reports in SharePoint. 3rd and 4th options need in depth knowledge in customization to build reports. But for using Power BI you need to buy a separate license. Obviously, we will go for the Excel Services/Excel Web Part option which comes with MS Office😎
So what BI features are available in SharePoint 2013/2016 (on-premises) but not available in SharePoint Online?🤔 
1. Performance Point Services (PPS dashboards)
2. Scorecards and Dashboards
3. SQL Server Reporting Services (SSRS) in SharePoint Integrated mode
For more information of what is not supported in SharePoint Online in Office 365, refer this article.🔗
Creating Power View reports in SharePoint:
1. For this demo, I have created a SharePoint List named "Finance Sample Data" using the data from Finance Sample records downloaded from Power BI site. Click to download. 🔗 It has around 700 records which is very less when we compare the data load which is 1 Million records.😮
2. Let's go ahead connect the data from SharePoint to Excel and create excel dashboards. If you are using Excel 2016 and don't see the Power View option in the ribbon, read this article to enable it.🔗
3. Open Excel -> new workbook -> Data -> New Query -> From Online Services -> From SharePoint Online List -> Enter the SharePoint Site URL -> Select the list "Finance Sample Data" from the list -> Click on Edit button at the bottom right corner to edit or you can load all columns as per your requirement -> You can choose columns or remove unwanted columns -> Load the data to Excel

4. Once the data is loaded it will open the blank Power View report. Now, it is time to add the report. 💡Remember Power View is a Silverlight based application and Power BI is HTML based application. Power View cannot be customized within the report. But Power BI is customizable. You can click any columns at the right side menu and add filters.
5. In the same way add data by dragging the fields. I have added the 4 report sections as shown below. The final report created in Power View is:
6. Also, when you click on the chart area, it will filter according to the data relationship and filter the data automatically 😃
7. Now, its time to publish the report to SharePoint so that we can display the report in a separate page. Very important, if you don't follow the below step you will get an error when linking the report in excel access web part. 
Instead of uploading the report to Document Library -> click on Save As -> Connect to the SharePoint Online site (if not connected already) -> then click on the site to view the libraries -> publish to the desired library

8. Add a new SharePoint page -> Insert Excel Web Access web part -> Add the link to the excel sheet published in SharePoint library -> Save it to view the Power View report in SharePoint.

9. Final report published in the SharePoint looks like below:
10. Next what? We forgot about the Data Refresh option. In the excel sheet -> click on the Data tab -> Connections -> Properties -> Usage as shown below:
As usual, I have shared the List used (List Template with content), Excel report created. Click here to download.
Please free to comment. Always. your comments help me to write more.😃 Share this post to others if this helps you!😇
Don't forget to subscribe to the posts to get notified about new tutorials by clicking the Subscribe button on the top right corner and follow us in social buttons as well.

Display SharePoint List or Library in Data table

Introduction:
Today we are going to learn an interesting article of how to use DataTables.js JQuery 🔗 in SharePoint(2013, 2016, Online - O365).
Since SharePoint 2013 has released, the way how the data is created, updated & displayed has changed a lot - I mean Client Side scripting has become more powerful. Server Side Coding in SharePoint (JSOM - Java Script Object Model) has the following uses or advantages over server side coding which are:
1. Faster data rendering
2. Easy to debug from browser
3. Easy & faster validation response to end users
4. Just add a content editor web part and add the code 😁
5. No IIS reset required
6. Just use client desktop and no SharePoint installation required
7. No Visual Studio (why spent extra money on license?😎)
8. Just use a Editor to write and format the code.
💡 I have recently started using Microsoft Visual Studio Code. Give a try, you will never use other editors. What a powerful editor! Download from this link and it is FREE 🔗
Scenario:
What if you were given a task to display a list or a library in a SharePoint page which has 1000's of records in it. Also, it has to load faster, need a free text search, paging features, etc.? But you have no server side access for coding or server deployments allowed 😜
Solution: 
Obviously, any SharePoint developer will go for the option SharePoint Java Script Object Model (JSOM). But how to create a table, searchable content, etc. DataTables.JS is a Table plug-in for JQuery. It is used for display the HTML content as Table.
Let's not wait and create a custom SharePoint list(here named it as Finance Sample Data). Download the data used for this example here 🔗
This is how the logic/solution for this scenario is implemented:
1. Upload the JQuery, DataTable.JS, CSS, Images required in Site Assets Library(best practice in SharePoint)
2. Create a simple text file in which add the reference to JS, CSS, Images, etc. Then add the DIV tags for creating a section and then add a TABLE tag for displaying the content, then document.ready() function and finally custom JS functions. You can also have HTML file and JS files separately.
3. In document.ready(), call the custom function which will query the data using CAML query (I haven't tried using REST API since there will be an issue when you query 1000 items at a time or when paging is enabled, if you have any thoughts share it in the command), load the JSON data as HTML tags and draw a data table using the data objects.
💡 Learn the basics of CAML query in SharePoint by reading this article: CAML Query tutorial for SharePoint 🔗
Code for reference:
<!-- JS References -->
<script src="../../SiteAssets/Scripts/jquery-1.12.0.min.js"></script>
<script src="../../SiteAssets/Scripts/jquery.dataTables.min.js"></script>

<!--CSS References-->
<link href="../../SiteAssets/CSS/jquery.dataTables.min.css" rel="stylesheet">

<!--HTML TAGS-->
<div id="divFinanceReportTable">
    <h3>
        <div>
            <p id="FinanceReportTitle"><b>Finance Sample Data</b></p>
        </div>
    </h3>
    <table style="width: 100%;" id="idFinanceReportList" cellspacing="0">
    </table>
    <div></div>
</div>

<!--Document.ready()-->
<script>
    var txtHTMLFinanceReport = "";
    var tableFinanceReport;
    var allFinanceReportData;

    $(document).ready(function () {
        //Load Finance Report List on page load
        SP.SOD.executeFunc('sp.js', 'SP.ClientContext', loadFinanceReportList);
    });

    //Load Tools from Tools List
    function loadFinanceReportList() {
        var currentClientContext = new SP.ClientContext.get_current();
        var currentWeb = currentClientContext.get_web();
        var financeReportDataList = currentWeb.get_lists().getByTitle('Finance Sample Data');
        var camlQuery = new SP.CamlQuery();
        var loadFinanceReportQuery = new SP.CamlQuery.createAllItemsQuery();
        var query = '<View><Query><OrderBy><FieldRef Name="ID" Ascending="TRUE"/></OrderBy></Query></View>';
        loadFinanceReportQuery.set_viewXml(query);
        allFinanceReportData = financeReportDataList.getItems(loadFinanceReportQuery);
        currentClientContext.load(allFinanceReportData);
        currentClientContext.executeQueryAsync(Function.createDelegate(this, this.success), Function.createDelegate(this, this.failed));
    }
    function success() {
        var segment = null;
        var country = null;
        var product = null;
        var unitsSold = null;
        var manufacturingPrice = null;
        var salesPrice = null;
        var grossSale = null;
        var sales = null;
        var profit = null;

        var USCurrency = { style: "currency", currency: "USD" };

        txtHTMLFinanceReport = "";

        var Header = "<thead>" +
            "<tr>" +
            "<th>Segment</th>" +
            "<th>Country</th>" +
            "<th>Product</th>" +
            "<th>Units Sold</th>" +
            "<th>Manufacturing Price</th>" +
            "<th>Sales Price</th>" +
            "<th>Gross Sale</th>" +
            "<th>Sales</th>" +
            "<th>Profit</th>" +
            "</tr>" +
            "</thead>";

        txtHTMLFinanceReport += Header;
        txtHTMLFinanceReport += "<tbody class='row-border hover order-column dataTable' role='grid'>";

        var listEnumerator = allFinanceReportData.getEnumerator();

        while (listEnumerator.moveNext()) {
            var currentItem = listEnumerator.get_current();

            if (currentItem.get_item('Title') != null) {
                segment = currentItem.get_item('Title');
            } else {
                segment = "";
            }

            if (currentItem.get_item('Country') != null) {
                country = currentItem.get_item('Country');
            } else {
                country = "";
            }

            if (currentItem.get_item('Product') != null) {
                product = currentItem.get_item('Product');
            } else {
                product = "";
            }

            if (currentItem.get_item('Units_x0020_Sold') != null) {
                unitsSold = currentItem.get_item('Units_x0020_Sold');
            } else {
                unitsSold = "";
            }

            if (currentItem.get_item('Manufacturing_x0020_Price') != null) {
                manufacturingPrice = currentItem.get_item('Manufacturing_x0020_Price');
                manufacturingPrice = manufacturingPrice.toLocaleString('en-US', USCurrency);
            }
            else {
                manufacturingPrice = "";
            }

            if (currentItem.get_item('Sale_x0020_Price') != null) {
                salesPrice = currentItem.get_item('Sale_x0020_Price');
                salesPrice = salesPrice.toLocaleString('en-US', USCurrency);
            } else {
                salesPrice = "";
            }

            if (currentItem.get_item('Gross_x0020_Sales') != null) {
                grossSale = currentItem.get_item('Gross_x0020_Sales');
                grossSale = grossSale.toLocaleString('en-US', USCurrency);
            } else {
                grossSale = "";
            }

            if (currentItem.get_item('_x0020_Sales') != null) {
                sales = currentItem.get_item('_x0020_Sales');
                sales = sales.toLocaleString('en-US', USCurrency);
            } else {
                sales = "";
            }

            if (currentItem.get_item('Profit') != null) {
                profit = currentItem.get_item('Profit');
                profit = profit.toLocaleString('en-US', USCurrency);
            } else {
                profit = "";
            }

            txtHTMLFinanceReport += "<tr>" +
                "<TD>" + segment + "</TD>" +
                "<TD>" + country + "</TD>" +
                "<TD>" + product + "</TD>" +
                "<TD>" + unitsSold + "</TD>" +
                "<TD>" + manufacturingPrice + "</TD>" +
                "<TD>" + salesPrice.toLocaleString() + "</TD>" +
                "<TD>" + grossSale + "</TD>" +
                "<TD>" + sales + "</TD>" +
                "<TD>" + profit + "</TD>";
            txtHTMLFinanceReport += "</tr>";
        }
        txtHTMLFinanceReport += "</tbody>";

        //Bind the HTML data to the Table
        $("#idFinanceReportList").append(txtHTMLFinanceReport);

        tableFinanceReport = $('#idFinanceReportList').DataTable(
            {
                "columnDefs": [
                    { "targets": [0], "visible": true, "width": "15%" },
                    { "targets": [1], "visible": true, "width": "8%" },
                    { "targets": [2], "visible": true, "width": "8%" },
                    { "targets": [3], "visible": true, "width": "8%" },
                    { "targets": [4], "visible": true, "width": "8%" },
                    { "targets": [5], "visible": true, "width": "8%" },
                    { "targets": [6], "visible": true, "width": "8%" },
                    { "targets": [7], "visible": true, "width": "8%" },
                    { "targets": [8], "visible": true, "width": "8%" }
                ]
            }
        );

        tableFinanceReport.draw();
    }
    function failed(sender, args) {
        alert("Data Reterival Failed: " + args.get_message());
    }

</script>

4. Now upload the text file either in a Document Library or preferably in Site Assets. Create a SharePoint page and then add a Content Editor web part. Refer the text file in the Content Editor web part and save it. That's it, we will see a very nice Table rendering the data as shown below:
5. The DataTables.JS has inbuilt functionalities which are listed below:
  • Free text search option (very fast)
  • Abililty of change the number of records display (25, 50, 100..)
  • Paging with Previous and Next options
  • Displays the number of items displayed and also changes the number according to paging
  • Ability to sort the columns both ascending & descending
  • Ability to query a column but hide it from view - if that specific column is required for internal data rendering logic or comparison or etc.
Cool, isn't it? 
Download the Custom List Template with contents (.STP file), JS files, images, text file which has the entire code from this link.🔗
Please free to comment. Always. your comments help me to write more.😃 Share this post to others if this helps you!😇
Don't forget to subscribe to the posts to get notified about new tutorials by clicking the Subscribe button on the top right corner and follow us in social buttons as well.
Happy Shar(Point)ing!

Update 25/07/2017
After reading our blog post, one of our readers shared Angular JS code for implementing the same concept in our Facebook page. Here is the code for reference as a bonus to the readers 😊
////....ANGULAR JS CODE....../////
angular.module('SPapp',['datatables'])
.controller("Splist",function($scope,$http,DTOptionsBuilder){
$http(
{
method:"GET",
url: GetsiteUrl() +"/_api/web/lists/getbytitle('Test')/items?$Select=Title,Job_x0020_Number,Approvl,Username/FirstName&$expand=Username/Id",
headers: { 
"Accept": "application/json;odata=verbose"}
}
).success(function(data,status,headers,config){
$scope.listdata = data.d.results;
}).error(function(data,status,headers,config){
});
$scope.dtOptions = DTOptionsBuilder.newOptions()
.withDisplayLength(10)
.withOption('bLengthChange', false);
});
function GetsiteUrl(){
var urlparts = document.location.href.split("/");
return urlparts[1] + "//" + urlparts[2] + "/" + urlparts[3];
}
////....END of ANGULAR JS CODE - SAVED as spapp.js......///// 

////....SharePoint Code saved as Text File....../////
<!-- JS References -->
<script src="../../SiteAssets/js/jquery-1.12.0.js"></script>
<script src="../../SiteAssets/js/jquery.dataTables.min.js"></script>
<script src="../../SiteAssets/js/angular.min.js"></script>
<script src="../../SiteAssets/js/angular-datatables.min.js"></script>
<link href="../../SiteAssets/js/jquery.dataTables.min.css" rel="stylesheet">
<script src="../../SiteAssets/js/spapp.js"></script>
<!--HTML TAGS-->
<div ng-app="SPapp" ng-controller="Splist">
<table datatable="ng" dt-options="dtOptions" id="myTable" class="table table-striped table-bordered" cellspacing="0" width="100%">
<thead>
<tr>
<th>Title</th>
<th>Username</th>
<th>Approvl</th>
<th>Job Number</th>

</tr>
</thead>
<tfoot>
<tr>
<th>Title</th>
<th>Username</th>
<th>Approvl</th>
<th>Job Number</th>
</tr>
</tfoot>
<tbody>
<tr ng-repeat="listdatas in listdata">
<td>{{listdatas.Title}}</td>
<td>{{listdatas.Username.FirstName}}</td> 
<td>{{listdatas.Approvl}}</td>
<td>{{listdatas.Job_x0020_Number}}</td>
</tr>
</tbody>
</table> 

</div> 
////....SharePoint Code....../////

Sep 28, 2015

Creating reports using OData Feed in Power BI

Today, I published my second Tech Net article about creating reports in Power BI using OData feeds after winning gold winner for TechNet Guru August month :)
To learn about basics of Power BI, click this article: Power BI in SharePoint Online
Articles in SharePoint Business Intelligence (BI) series: 🔗
Power BI in SharePoint Online
Creating reports using OData Feed in Power BI
Power View report in SharePoint
Display Power BI reports in SharePoint Online
Scenario:
In this article, let’s get the data from OData (Open Data Protocol) feeds and use the Power BI desktop software to design reports and publish it to Power BI site
To learn more about what OData is and how to integrate, read the following articles:
  1. https://msdn.microsoft.com/en-us/data/hh237663.aspx 
  2. https://support.office.com/en-us/article/Access-OData-Feeds-from-Power-Query-82BD48B9-6A2F-4F2A-83C9-6868BA1D30E2
  3. http://www.odata.org/   
    Read my article from the following TechNet link and share your valuable comments:

                     Creating reports using OData Feed in Power BI

    Power BI Dashboard screenshot reference:

    Power BI Dashboard from mobile app reference:


    Update 26-Oct-2015

    I am happy to share with you all that my second TechNet article is awarded for SQL BI and Power BI Technical Guru - September, 2015.
    Gold Winner!!!!
    Also, this post is highlighted in TechNet Wiki Magazine, 12th edition | Last Articles Spotlight and Guru Awards Edition. :)