As you all know, Microsoft is improving the BI capabilities with a lot of new features with exciting releases in the year 2015. Microsoft has introduced new add-ins called Power Query and Power Map for Excel 2013.
Believe me guys, this is really awesome add-ins which taken the Microsoft's BI capabilities one step ahead of all other BI competitors!
Let's try to create a power map by searching a public data using power query in Excel 2013 in this article.
Before trying a sample, let's understand what is power query and power map for excel 2013 and it's download links:
Power Query:

Power Map:
Excel Add-in Links:
Creating a Power Map with GeoFlow:
Let's add a public data from internet by using Power Query - connecting data from the existing excel file.
I have downloaded the U.S. Operable Generating Units in the United States by State and Energy Source, 2011 from the link. Thank you for the data!
Open the excel 2013 -> Power Query tab -> Get External Data -> From Excel

This will open the query editor where you can select the data sets (this downloaded excel sheet has various tabs with different power sources). You can combine the data using Power Query data editor as well.
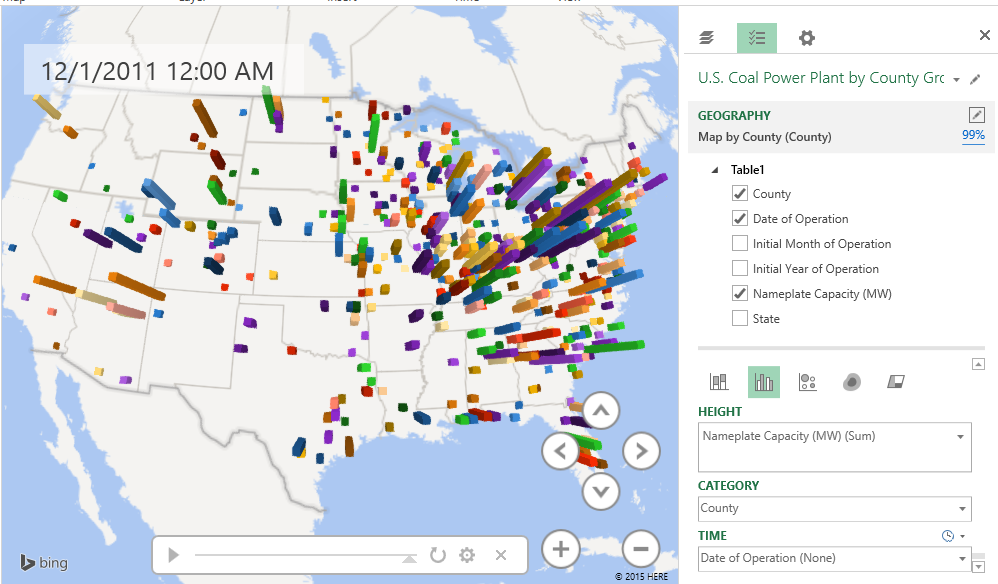
Let's select only "Coal" worksheet, delete the unwanted columns and create a date column using initial month and year (which is required for showing the growth of coal energy plants across U.S by county in power map) as shown below:

 The other one is coal power generated in U.S. by county with a time by using Initial Month of Operation column as shown below:

Power Map gives the options of creating video tour in a single click from the menu. Here is the video, I created from this sample:
Cool, isn't it?
Thanks for reading! Don't forgot to share this post and post your valuable comments which will make me write more.
Believe me guys, this is really awesome add-ins which taken the Microsoft's BI capabilities one step ahead of all other BI competitors!
Let's try to create a power map by searching a public data using power query in Excel 2013 in this article.
Before trying a sample, let's understand what is power query and power map for excel 2013 and it's download links:
Power Query:
- Microsoft Power Query for Excel (a data analysis tool) is an Excel add-in that enhances the self-service Business Intelligence experience in Excel by simplifying data discovery, combine, refine, access and collaborate.
- Power Query supports importing data from a wide range of Web sources, including scrapping tables from HTML pages, as well as importing data from Web APIs. Power Query supports XML, JSON and OData formats
- It includes intuitive discovery features, a powerful query language, and a built-in ability to share your discoveries with others

Power Map:
- Power Map provides interactive, 3D visualization with geospatial and temporal data
- It enables information workers to discover and share new insights from data through
- rich, 3D visualization on a globe with fluidic appearance & guided cinematic tours
- seeing time-stamped data change over time (which you might not have seen in traditional 2D tables and charts) and to share it with others
- you can create a video tour easily in a single click
- Geo flow is another feature which shows how the
- data changed over a period of time

Excel Add-in Links:
Creating a Power Map with GeoFlow:
Let's add a public data from internet by using Power Query - connecting data from the existing excel file.
I have downloaded the U.S. Operable Generating Units in the United States by State and Energy Source, 2011 from the link. Thank you for the data!
Open the excel 2013 -> Power Query tab -> Get External Data -> From Excel

Let's select only "Coal" worksheet, delete the unwanted columns and create a date column using initial month and year (which is required for showing the growth of coal energy plants across U.S by county in power map) as shown below:

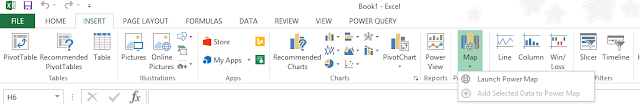
Now, click Insert Map -> Power Map option in the excel file -> Power Map will load the data source and it should automatically detect the geo-location fields from the dataset.
I have created two types of visualizations, one which is heat map visualization which will show the coal power generated in U.S. by state as shown below:

Power Map gives the options of creating video tour in a single click from the menu. Here is the video, I created from this sample:
Thanks for reading! Don't forgot to share this post and post your valuable comments which will make me write more.


