We will soon learn how to create Business Intelligence reports using Power BI and integrate SharePoint & Power BI in this blog. Make sure you subscribe to get emails and updates on latest articles 😎
When I tried to create a Power View report using Excel 2016, I couldn't find where is the Power view option from Ribbon in Excel 2016?
 Did Microsoft remove it from normal ribbon view? 😣I feel that this is an important option and it should be in normal ribbon view.
 Though there are some articles out there, I want my readers to know the step by step guidelines to enable the Power View in Excel 2016 😀
1. Click Excel -> Blank work book -> File -> Customize Ribbon -> Choose from Commands drop down -> Select Commands not in the Ribbon -> look for "Insert a Power View Report" -> I am adding it in a group which I created called "Reports" as shown below:
 2. Once you add this you should be able to see the Power View option in the Ribbon in the section whichever you added (here it is in Insert -> Reports) as shown below:
 That's it, you should be able to add Power View reports from the ribbon as usual in a click.
Bonus for the readers of this article:
Where is the Power Query option in Excel 2016?
If you use Excel 2013, after enabling Power Query after installation you will see the option in a separate tab as shown below:
 But in Excel 2016, Microsoft changed it as shown below:

When I tried to create a Power View report using Excel 2016, I couldn't find where is the Power view option from Ribbon in Excel 2016?

1. Click Excel -> Blank work book -> File -> Customize Ribbon -> Choose from Commands drop down -> Select Commands not in the Ribbon -> look for "Insert a Power View Report" -> I am adding it in a group which I created called "Reports" as shown below:


Bonus for the readers of this article:
Where is the Power Query option in Excel 2016?
If you use Excel 2013, after enabling Power Query after installation you will see the option in a separate tab as shown below:


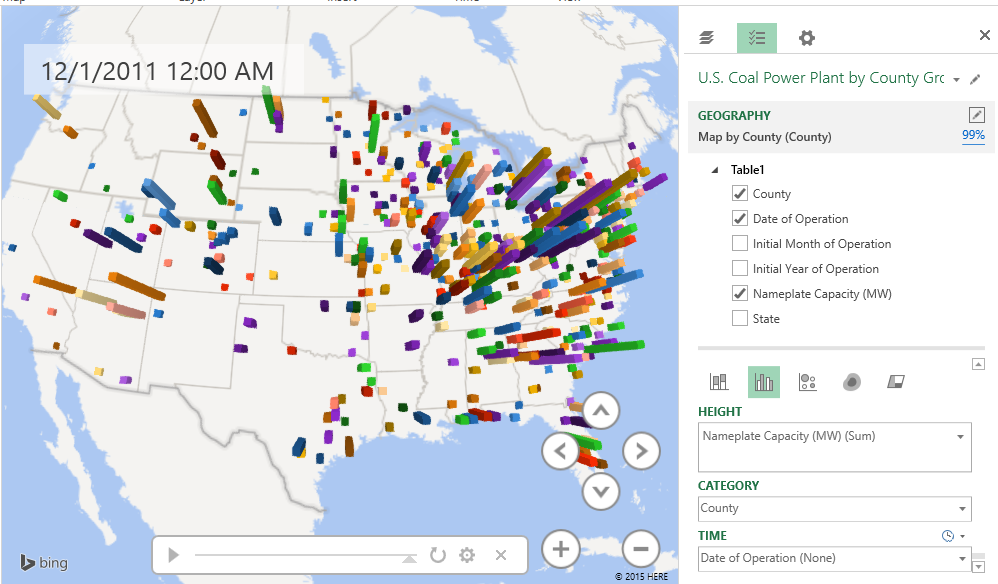
💡🔗 If you are interested reading about Power Query and Power Map, read this article
Happy reading! 😃