Introduction:
In this article, we will learn how to create a report in Power BI using SharePoint List as a data source, using DAX (Data Analysis Expressions) in Power BI, publish the Power BI report to SharePoint Online, and Schedule Data Refresh. We will also learn how to use Power BI desktop tool which is used for designing reports in Power BI.
Articles in SharePoint Business Intelligence (BI) series: 🔗
1. SharePoint Online - Office 365 (applicable to SP 2016/2013)
2. Power BI - needs Power BI Pro License
3. Power BI for desktop - for designing the report
Create report using Power BI Desktop from SharePoint List as Data Source:
1. Let's use the same data Finance Sample Workbook from Power BI site for this example as well
2. Load the data in SharePoint List
3. Open the Power BI for desktop tool and sign in using your O365 ID & password
4. Click File -> New -> It should open the blank report
5. Click Get Data option from Home menu -> More -> Online Services -> SharePoint Online List as shown below:

Power BI for Mobile - Windows, App Store, Google Play
Power BI report file
Sales report exported to PowerPoint
So, we have learnt how to create a Power BI report from SharePoint List as data source, created DAX expressions, added different chart types, published the report to Power BI and then to SharePoint Online, SharePoint Online with out Power BI Pro and also applicable to SharePoint 2013 & 2016.
In this article, we will learn how to create a report in Power BI using SharePoint List as a data source, using DAX (Data Analysis Expressions) in Power BI, publish the Power BI report to SharePoint Online, and Schedule Data Refresh. We will also learn how to use Power BI desktop tool which is used for designing reports in Power BI.
Articles in SharePoint Business Intelligence (BI) series: 🔗
Power BI in SharePoint OnlineEnvironment:
Creating reports using OData Feed in Power BI
Power View report in SharePoint
Display Power BI reports in SharePoint Online
1. SharePoint Online - Office 365 (applicable to SP 2016/2013)
2. Power BI - needs Power BI Pro License
3. Power BI for desktop - for designing the report
Create report using Power BI Desktop from SharePoint List as Data Source:
1. Let's use the same data Finance Sample Workbook from Power BI site for this example as well
2. Load the data in SharePoint List
3. Open the Power BI for desktop tool and sign in using your O365 ID & password
4. Click File -> New -> It should open the blank report
5. Click Get Data option from Home menu -> More -> Online Services -> SharePoint Online List as shown below:
6. Enter the SharePoint URL - just the site collection but not till List
7. Once you enter, select Microsoft account option from Anonymous, Windows, Microsoft account options displayed for authentication as shown below:
8. Once authenticated & connected, it will display all lists and library in the site collection. Select the List (which we loaded the Finance Sample excel work book) and either click edit to edit the columns or click Load to load the data to the Power BI
9. Important point to note is that we have loaded the Finance Sample Excel Workbook in to SharePoint List and now the data is connected to Power BI. If you notice the loaded data (columns Gross Sales, Sales Price, COGS, Profit related to cost) in Power BI are loaded as text instead of $$$ value in this example
10. Using Power BI, we can change the data type (NOTE: 💡changing the data type will affect the data refresh so it is a good practice to change the data type in the source or load the data at source with appropriate data type). For this example, I have changed the data type in Power BI for desktop.
Option is Data section -> Modeling tab in Ribbon -> Data Type & Format as shown below:
11. Loaded data and updated with data type is shown below:
12. In the above data loaded, we see the month, year are in a separate column, let's use DAX expression to combine them and display as Year - Month in a separate column.
I have added a new column "Date" as shown below:
13. Once the data is loaded, fields section shows the column that can be added to report, also the fields which can be displayed as aggregate/sum and also the measure which we created (Date field in above step):
14. Now, it's time to add the charts in the report section. I have used Card, KPI, Line & Clustered Column Chart, Pie Chart, Line Chart as shown below:
Publish the report to SharePoint Online (Power BI Pro)
15. Now, it's time to publish the report to SharePoint Online 😃
First step is to publish the report to work space in Power BI site then to SP Online.
Log in to the Power BI site. In the above step, I have published the report to "My Workspace" section. Hence navigate to the My Workspace section in Power BI site -> Reports section (since this is published as report but not dashboard) -> click on the report ("Sales Report")
Now, click on the File -> click on select Embed in SharePoint Online preview as shown below. This will give the link to publish the Power BI report to SharePoint Online.
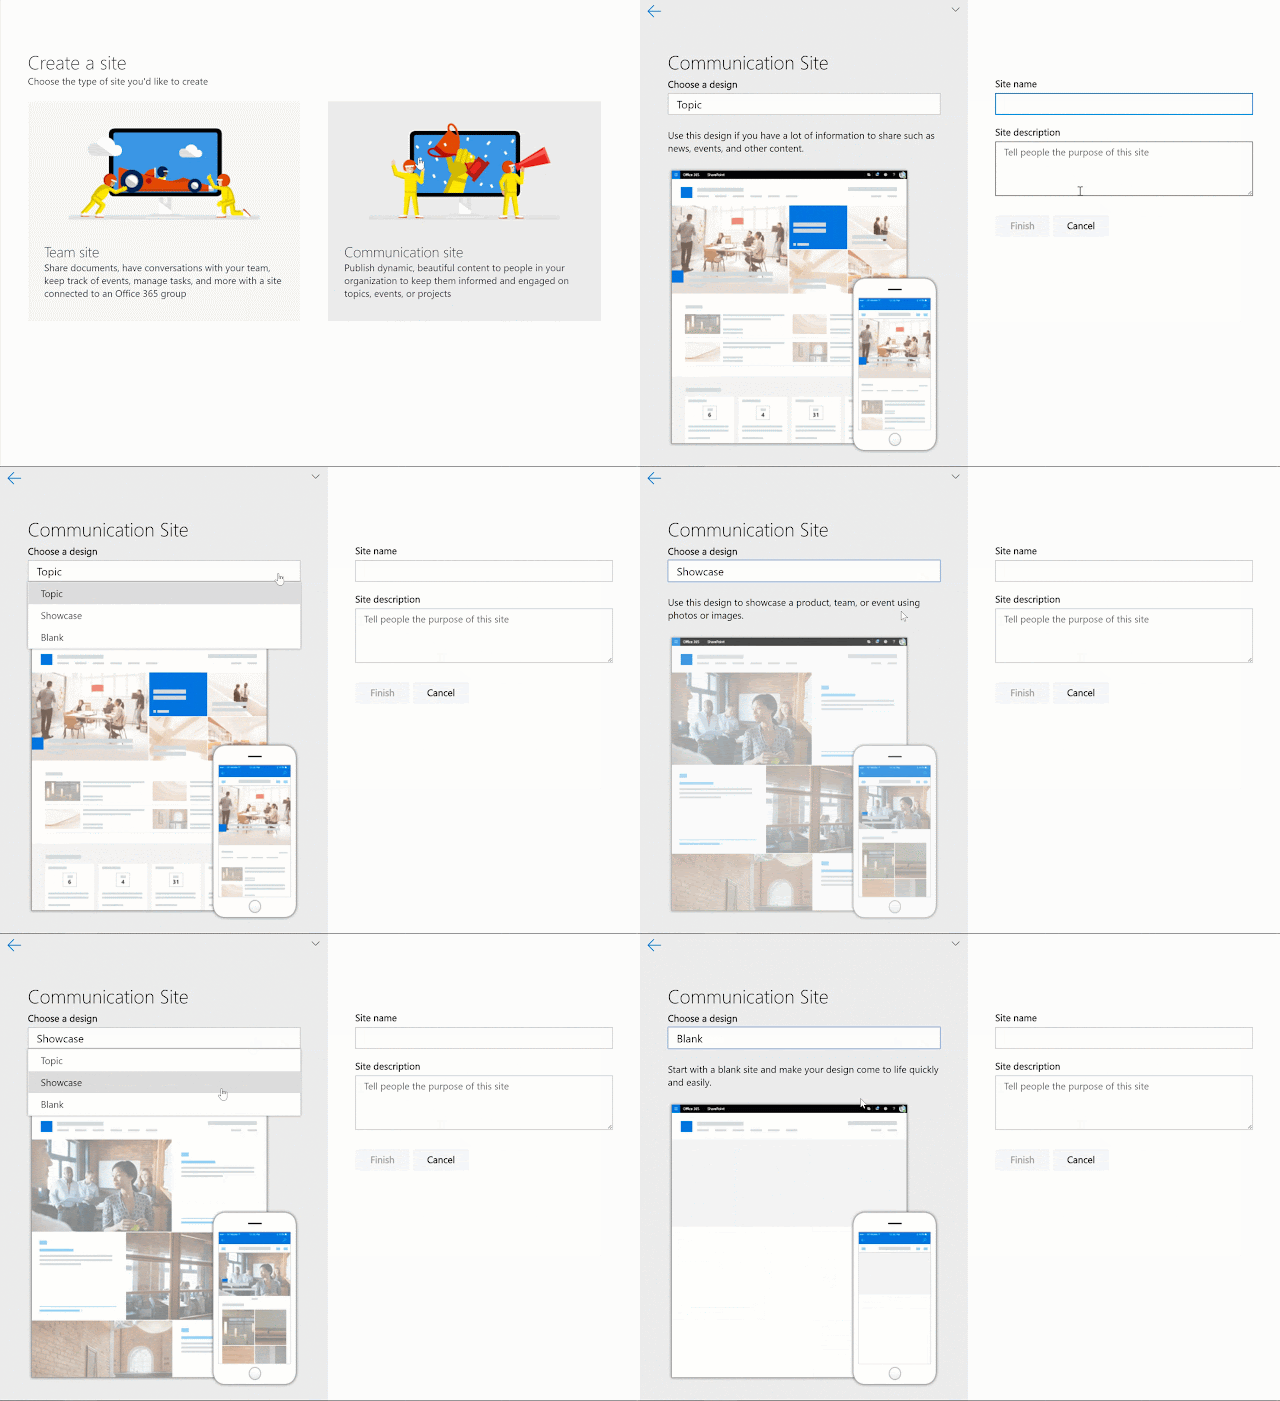
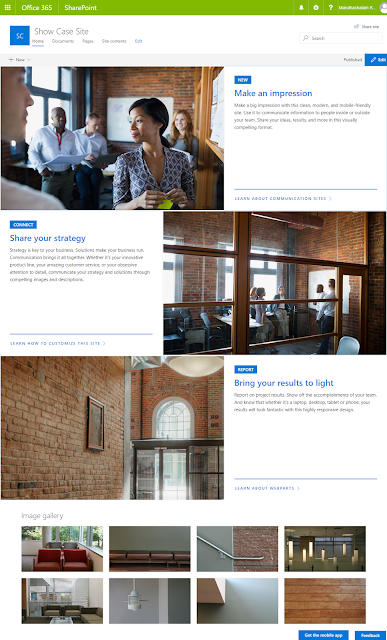
16. Now, time to integrate the report in SharePoint Online. In previous article, I have explained about creating Communication Sites in SharePoint Online. In this site, create a page and add Power BI (preview) web part
17. Now, name the page and publish the page. Below is the preview of the page and how the filter works in the chart according to the selection:
💡 Embed in SharePoint Online is only available with Power BI Pro. Each user that views the report mush have a Power BI Pro license. If they do not have a Pro license, they will be prompted to sign-up to view the report.
18. Next one final step is "Data Refresh". Navigate to the Power BI site again -> Workspaces -> My Workspace -> Datasets -> select your report (Sales Report) -> Schedule Refresh button in Actions section to schedule the data refresh as shown below:
Apple Power BI App preview of the report
Granting Access to reports:
Embedding a report in SharePoint Online does not automatically give users permission to view the report in SharePoint site. The permissions to view the report are set within Power BI service itself.
There are two ways to provide access to the report within the Power BI service.
1. If you are using Office 365 Group to build your SharePoint Online team site, you list the user as a member of the app work space within the Power BI service. This will make sure that users can view the contents of that group. For more information, see Create and distribute an app in Power BI. 🔗
2. Alternatively, you can grant users access to your report by doing the following.
Add a tile from the report to a dashboard.
Share the dashboard with the users that need access to the report. For more information, see Share a dashboard with colleagues and others. 🔗
Publish the report to SharePoint (without Power BI Pro option)
Suppose you don't have Power BI pro license but want to integrate the Power BI report in SharePoint 2013 or 2016 or in SharePoint Online, then Page Viewer is the option we have 😉
Navigate to the page where you want to display the Power BI report -> add a Page Viewer Web Part -> add the link copied from Power BI site (Report -> File -> Embed in SharePoint Online(Preview)-> copy the link)

Differences between publishing using Power BI pro & in Page Viewer web part
1. Show/Hide Navigation Page, Filter Pane options are available only in Power BI
2. Options to change the display size of the report is available only in Power BI pro
3. Sorting the each section of report by it's main report parameter is available only in Power BI pro
4. Option to See Data of a particular report is available only in Power BI pro
5. All the above options are not available in normal publishing way
6. Share the report via Facebook, Twitter, Linked In, Email, & information about report, flagging report option is available in normal publihing method (Page Viewe web part)
Export to PowerPoint (Preview)
There is another option available in reports in Power BI site which is Export to PowerPoint(Preview). Navigate to Power BI Site -> Select the report -> File -> Export to PowerPoint (Preview) as shown below:
The exported file is attached here to know how a exported Power BI report looks like. See Downloads section for the file.
Downloads: 🔗
Power BI DesktopPower BI for Mobile - Windows, App Store, Google Play
Power BI report file
Sales report exported to PowerPoint
So, we have learnt how to create a Power BI report from SharePoint List as data source, created DAX expressions, added different chart types, published the report to Power BI and then to SharePoint Online, SharePoint Online with out Power BI Pro and also applicable to SharePoint 2013 & 2016.
Please free to comment. Always. your comments help me to write more.😃 Share this post to others if this helps you!😇
Don't forget to subscribe to the posts to get notified about new tutorials by clicking the Subscribe button on the top right corner and follow us in social buttons as well.


